
Welcome to the latest edition of The Road to Zero Report
The BVRLA’s Road to Zero Report is an annual assessment of the UK’s progress towards zero-emission road transport. Launched in 2019, it provides an overall ranking of progress before taking a deeper look at the respective performance of ZEV demand, infrastructure and supply. Progress for cars, vans, and HGVs are considered in isolation, due to their varying trajectories.
Report produced in association with

Cars | Vans | Trucks
How are they faring?

Cars
Where incentives are right, especially salary sacrifice and company cars, strong growth continues. OEM discounts, due to ZEV Mandate pressures, led to increased demand for personal leasing, but it is unclear if this will hold. Despite significant improvements in vehicle affordability, demand remains low when there are no incentives. The used BEV market is a continued threat as supply into the second-hand space outpaces demand and prices continue to slump, showing no sign of stabilising.

Vans
Demand for electric vans remains slow. Alongside regulations, the capabilities of e-vans are a major obstacle. Despite improvements in range and charging speeds, the cost of electric vans remains too high. Challenges are compounded by a lack of suitable public charging, with steep costs and the investment levels needed to install private infrastructure. Until van fleets, in particular SMEs, are truly confident that the product, costs, and operations are comparable to their diesel vans the transition will continue to lag outside the largest fleets.

Trucks
It is still early days for HGVs. Technological uncertainty remains, and affordability remains a key challenge. There are signs of progress with the £200 million funding for the Zero Emission HGV and Infrastructure Demonstrator programme (ZEHID). This will bring more ZEV HGVs into operation to share much-awaited learnings with the sector. ZEHID has recently announced 54 new charging hubs, which will be instrumental in any zero emission HGV rollout. Grid connection challenges will become more common as fleets move beyond trials and need to be addressed with some urgency.
Key Themes
Demand
Business car leasing continued to grow through salary sacrifice and company car schemes. Personal leasing was also positive as consumers could access attractive offers, driven by the market’s push for ZEV Mandate compliance.
The weakness of the used BEV market is a huge threat to any positive progress that has been made.
Demand for rental and for e-vans continues to be a struggle away from large corporate clients with decarbonisation goals to meet.
Cost of ownership is becoming harder to balance as the disparity between those able to charge at home and those reliant on public infrastructure grows.
KPI's for Demand
The key performance indicators used to track demand levels
Rental Customer Demand
2025: Parked
2024: Parked
2023: Parked
ZEV utilisation in rental fleet
Despite growth in the ZEV fleet in 2025, ZEV utilisation relative to the overall rental fleet has decreased for both cars (69%) and vans (77%) compared to 2024 (cars 73% and vans 81%). This remains lower than the total utilisation rate of 83% for cars and 86% for vans. [BVRLA]

Business Leasing Demand
2025: Cruising
2024: Accelerating
2023: Cruising
Percentage of ZEVs in leased fleet
Percentage of ZEV cars in leased fleet – ZEV share of cars in business leasing has grown from 34% in 2024 to 40% in 2025, driven by new additions in company cars (54%) and salary sacrifice (87%). This remains far ahead of the UK wide ZEV uptake of 20% [BVRLA]
Percentage of ZEV vans in leased fleet – BEV vans had a 6.6% share in Q4 2024, rising from 3.4% in Q4 2023. [BVRLA]

Personal Leasing Demand
2025: Cruising
2024: Brakes on
2023: Accelerating
Cost of Ownership
2025: Brakes on
2024: Brakes on
2023: Brakes on
Cost of fuel and energy (public)
Cost of fuel and energy (home)
Cost of vehicle
Cost of fuel and energy (public) – The cost per litre equivalent of charging an EV is 124p/litre at a public slow/fast chargepoint, slightly below the current cost of 138p/litre for a petrol car. However, charging at a public rapid/ultra-rapid chargepoint remains significantly more expensive at 190p/litre. [Zapmap]
Cost of fuel and energy (home) – The cost per litre equivalent of charging an EV is 59p/litre for home charging at the domestic price cap, and 18p/litre during off-peak charging. This is significantly cheaper than the cost per litre of 138p/litre for a petrol car in April 2025. [Zapmap]
Cost of vehicle – Despite the growth in lower price BEVs, the median price of a new BEV car has increased slightly from £49,165 in 2024 to £49,760 in 2025. This remains higher compared to an ICE car at £37,438. A similar story is seen for vans with the median price of a new BEV van (£53,885) greater than an ICE van (£50,540) in 2025. [Autotrader]

Used ZEV Market
2025: Parked
2024: Parked
2023: Brakes on
Supply vs Demand RV impact
Demand vs supply of used BEVs
Used BEV sell times
Supply vs Demand RV impact– BEV’s (-1.5%) have depreciated more than ICE (-0.2%) month over month in 2025. In cumulative terms, BEV values have fallen by 11.3% in the last 12 months compared 1.7% for diesel and -0.3% for petrol. [CAP-HPI]
Demand vs Supply of Used BEVs – Over the past year the supply of EV’s entering the market has surged by 51%, exceeding the record levels of EV demand which has grown 22% year-on-year. [Autotrader]
Used BEV Sell Times – BEVs went from being the fastest selling fuel type in the second half of last year to the slowest selling in the first half of 2025. The average time to sell a BEV has increased to 34 days in March 2025, while this is rapid, it is slower than petrol (29 days) and diesel (31 days). [Autotrader]
Did you know?
Key Insights
Demand
£49,760
Median price of new ZEV car
£53,885
Median price of new ZEV van
Rental Demand
The number of ZEVs on rental fleets remains low due to limited demand from customers. While the number of ZEVs in the rental fleet has increased, the utilisation of BEVs has decreased.
Rental operators are working hard to drive demand and have had some successes, but this tends to be focused among corporate customers or those who are accustomed to driving an EV and use a rental vehicle as an insurance replacement.
One of the biggest challenges cited is infrastructure, where renters lack confidence in the availability and the time to charge.
Demand for rental e-vans continues to be a challenge, with the cost versus the capability of the vehicle compared to diesel being an ongoing concern.
Leasing Demand
Business leasing demand continues to see good growth (40% ZEV share in business leasing) with demand being driven by effective incentives and continued growth in BEV adoption amongst company car and salary sacrifice schemes. The impact of these schemes are clear, with over 70,000 BEV vehicles delivered via salary sacrifice schemes in 2024.
Business Contract Hire (BCH), the largest leasing product, also contributed to this trend, with market share of electric vehicles increasing from 37% in 2024 to 44% in 2025, and the share of new registrations increasing from 44% to 54%.
Battery electric vans reached a 7.6% market share in May 2025, up from 4.7% in June 2024 [REF], which is reflected in BVRLA business leasing figures showing a rise from 3.4% in Q4 2023, to 6.6% in Q4 2024. This is despite a -11.8% fall in total LCV registrations in May, marking the sixth consecutive month of decline [REF]. Despite encouraging signs of growth, and over 40 BEV models to choose from, zero emission vans continue to fall short of the ZEV Mandate target – 16% in 2025 [REF]. Continued weak demand is being attributed to concerns over product suitability, with range, payload, cost, and regulatory uncertainty, cited as key barriers preventing electric vans from meeting operational needs of many businesses [REF].
Personal leasing demand has increased to 28% of new registrations from 16% —reflecting growing consumer interest in electric vehicles (EVs).
Personal leasing remains behind business leasing as there are not the same incentives driving demand. Additional costs, such as the Expensive Car Supplement from April 2025 may reduce the number of those opting for a BEV on a personal lease.
A dual challenge of weakening residual values, pushing up lease rates, and the flexibilities now offered to OEMs in the ZEV Mandate, possibly reducing discounts, might reverse the strong demand growth.
The cost of public charging is likely to be a deterrent to those unable to charge at home or at the workplace.
Vehicle Costs
The median price of a new ZEV car has marginally decreased from £49,165 in April 2024 to £49,760 in April 2025. This remains higher than ICE at £37,438. According to Autotrader’s “Road to 2030” report, the average recommended retail price of a new electric car was 35% higher than that of an equivalent ICE model at the start of 2024, but by the beginning of 2025 this price gap had narrowed to 24%. While lower-priced EV options are emerging, the overall market is still influenced by higher-priced models.
EV prices have risen slightly ahead of inflation (4%) since 2024 and remain higher than ICEs, despite battery prices falling. While heavy discounting was reported late in 2024 to meet the ZEV Mandate, recent changes from April 2025 now offer manufacturers greater flexibility in meeting targets. This may reduce the need for such aggressive discounting.
The median price of a new ZEV van has fallen slightly from April 2024 (£54,934) to 2025 (£53,885) but remains 7% higher than ICE vans (£50,540). However, when adjusting for differences in the mix of ZEV and ICE models to compare like-for-like vehicles, ZEV vans are, on average, 47% more expensive.
Source: Autotrader
Charging Costs
Public EV charging costs:
- According to Zapmap, as of January 2025, the average pay-as-you-go (PAYG) price for slow/fast chargers was approximately 53p per kilowatt-hour (kWh), while rapid/ultra-rapid chargers averaged around 81p/kWh.
- Following a period of rising prices, these are similar to or slightly below 2024 prices [REF].
Home EV charging costs
- The cost of EV charging at home rose in April 2025 after Ofgem confirmed new energy price cap rates, rising from 24.9p/kwh to 27.1p/kWh, representing an approximate 8% increase [REF].
- Home charging EVs remains significantly cheaper than fuelling ICE vehicles, equivalent to 71 pence per litre of petrol at the domestic price cap, and less than 22 p/litre with the cheapest off-peak tariffs.
- As of March 2025, at least five EV tariffs offered off-peak prices of less than 9p/kWh [REF]
Used Battery Electric Vehicle (BEV) Market
While used BEV transactions saw strong growth in 2024 (up 57.4% to 188,382 units), supply is outpacing demand. The growing number of new BEV registrations driven by the leasing sector means a projected 178% rise in used BEV stock by 2028 [REF]. This will lead to continued high levels of pressure on values and a weak and volatile used market – impacting both the wholesale and retail markets.
Values of used BEVs have declined across all age and mileage profiles in February 2025, with drops ranging from 1.6% to 2.2 %. Used EV retail prices plunged 43% (Jan 2023-Oct 2024) [REF], and UK residual values are forecast to fall a further 7.5% by December [REF]. This deep depreciation is costing fleets millions [REF] and indicates a “broken” market for value retention.
Attractive offers on new and more advanced technology in new BEVs has made them more appealing than their used counterparts. There is no sign of stability for used BEVs in the next few years. Without intervention, this trend will make the transition non-viable.

Key Themes
Infrastructure
Chargepoint numbers have continued to increase, and track the exponential growth needed to reach 300,000 by 2030. While the charging experience continues to improve, the reliability stats, especially for rapid and ultra-rapid chargepoints, remain below the reliability standard of 99 99%.
Problems persist with accessible chargepoints for disabled users and vans. There is still no evidence of chargepoints that can be booked, which is crucial for commercial vehicles and future proofing.
Local deployment of infrastructure is being supported by government funding, with good uptake from local authorities. Engagement with fleets to ensure these chargepoints meet their needs remains critical.
KPI's for Infrastructure
The key performance indicators used to track demand levels

Public charging availability and reliability
2025: Cruising
2024: Cruising
2023: Cruising
Public chargepoint numbers
Percentage of chargepoints out of service
Public chargepoint numbers Public chargepoint numbers continue to increase – over 80,000 in May 2025 according to the latest Zapmap figures. Total numbers continue to track exponential growth towards the UK’s aim of 300,000 charge points in 2030. [Zapmap, DfT EV charging statistics]
Percentage of chargepoints out of service – March 2025 data indicates continued improvements in network reliability with slow/fast chargers (< 50kW) achieving a network reliability of 99.1% according to Zapmap. Rapid/ultra-rapid (> 50 kW) charge point reliability of 97.2% remains below the government’s public charge point regulations target of 99%. [Zapmap]
Public Charging User Experience
2025: Brakes on
2024: Brakes on
2023: Brakes on
Percentage of network with live data
Percentage of network that is pre-bookable
Ease of payment across network
Percentage of network that is van accessible
Percentage of network with live data – As of the 31st March 2025, more than 80% of the public chargepoints covered by Zapmap show live data status, marking a 5% increase in live data coverage from last year. [Zapmap, GOV.UK]
Percentage of network that is pre-bookable – Pre-booking remains unavailable. Some CPOs are conducting limited trials and this is now being explored for use with commercial vehicles. [Ricardo analysis]
Ease of payment across network – Leading EV fuel card providers currently cover approximately 75% of the network, over 60,000 chargepoints. No service currently offers access to the entire charging network. [Zapmap, EV Fuelcard Providers]
Percentage of network that is van accesible – Van accessibility continues to be a challenge, with no centralised monitoring or publicly available data to support fleet operators in locating suitable chargepoints. Some providers are exploring solutions, but these tools remain in early stages of testing and do not cover the full range of commercial vehicle types.
Ease
of
Implementation
2025: Brakes on
2024: Brakes on
2023: Brakes on
Average grid connection times
Average grid connection times – Ofgem’s latest grid connections data from 2023-2024 suggests that DNOs are, on average, achieving targets on time to quote and connect (TTQ/TTC). However, real world experiences show challenges persist. Several government initiatives are seeking to resolve challenges and reform the connection process. [Ofgem]
Local Authority Support
2025: Amber accelerating
2024: Brakes on
2023: Parked
Progress in funding local authority infrastructure
Progress in funding local authority infrastructure – 53% of English Local Authorities who have applied for funding through the Local Electric Vehicle Infrastructure (LEVI) Fund have had their projects approved for delivery – representing £205 million in capital funding. A further 77% of the £343 million total funding is approved for delivery/pending final review [UK Government]. Funding is available through separate schemes in Scotland, Wales and Northern Ireland.
Did you know?
Key Insights
Infrastructure
117
Upper-Tier local authorities have been approved for LEVI funding
Public chargepoint deployment & reliability
Public charge point deployment & reliability
At the end of May 2025, there were 80,998 electric vehicle chargepoints in the UK, across 39,773 charging locations. This was a 30% increase compared to 2024 [REF].
Chargepoint numbers continue to track an exponential path towards the government aim of 300,000 chargers by 2030, despite a slight slowing in the rate of growth since last year. An increased deployment rate will be required over the next five years to remain on target. [REF]
The geographic distribution of chargepoints in the UK remains uneven, with a significant concentration in London and the South-East (Table 1) – 43% in April 2025. [REF]
The West Midlands has experienced the fastest growth in deployment over the past year, with a 44% growth in charger numbers from April 2024 – April 2025. The Northeast was the only region outside Northern Ireland to witness a decline in public charging devices from Q1-Q2 2025. [REF]
In terms of charger availability per 100,000 people, Northern Ireland lags significantly behind other UK regions, with just ~35 devices per 100,000 population, compared with the national average of 113. [REF, REF]
The percentage of out-of-service charge points has decreased from 1.9% in the year to March 2024 to 1.3% in March 2025. [Zapmap]
Figure Source: DfT Electric Vehicle Public Charging Infrastructure Statistics, April 2025
Public charging user experience
Since November 2024, the Public Charge Point Regulations have required all CPOs to provide open data [REF]. While over 80% of charge points on Zapmap now deliver real-time status updates, full network compliance is still pending. Pre-booking functionality, critical for fleet operations, remains largely unavailable, with only limited trials underway [REF, REF, REF].
Roaming coverage is improving. Over 75% of the UK’s public charge points are now accessible through major EV fuel card providers.
Physical accessibility continues to fall short. Most infrastructure still lacks compliance with the latest accessibility standards (BSI PAS 1899), and comprehensive data on disabled user access is not yet available [REF]
For commercial vehicles, van accessibility is not consistently monitored. While certain platforms are trialling size-based filtering tools, they are limited and early-stage [REF]. More targeted action from CPOs is required to meet the needs of fleet operators and disabled drivers alike.
Despite ultra-rapid (150kW+) chargepoints representing the fastest growing segment of the public charging network, only two models (6%) of e-vans can take this charge. Only four can take a charge over 100kW. This highlights a disconnect between infrastructure investment and e-van capability.
Ease of implementation
Grid connections data published by Ofgem suggest how Distribution Network Operators (DNOs) are, on average, achieving targets on time to quote (TTQ) and time to connect (TTC). [REF] All but one of the 14 DNOs assessed received green RAG ratings for TTQ, with an average TTQ of 2.57 days; 10 out of 14 received green ratings for TTC with an average TTC of 31 days. However, real world experiences show challenges persist.
The cost in many cases remains too high, especially where grid reinforcement work is needed. Fleet operators continue to report concerns about the lack of standardisation across the DNOs and complexities at every stage of the grid connections process.
The Energy Networks Association has been working with the BVRLA and has recently published guidance which will help operators navigate the complex process and point them to where more help is available.
Ofgem is also looking at how it can improve the customer journey for those looking to install EV chargepoints.
Local Authority Support
The £450 million LEVI programme (2022–25) supports local public EV chargepoint deployment, building on the previous On-Street Residential Chargepoint Scheme (ORCS). As well as funding capital projects, this funding has supported 216 full-time dedicated EV infrastructure officer roles, 158 of whom are in post across Tier 1 English local authorities. [REF]
117 Upper-Tier LAs (including combined authorities) out of 152 total have been approved for LEVI funding. [REF, REF]
Similar schemes exist in Scotland and Wales. There’s no recent scheme for Northern Ireland, where under ORCS a consortium of 9 out of 11 councils were successful in August 2022, receiving £1.35 million, plus £0.5 million match funding. [REF]

Key Themes
Supply
Affordable car models have doubled – with 12 new models under £25k. By contrast, there are only two new e-van models under £30k.
Vehicle efficiency continues to improve, but for larger vans in particular, range still comes at a steep cost.
The ZEV Mandate’s absolute targets have not been met, but compliance is expected through flexibilities.
BEV repair times and costs have improved, with costs remaining below ICE. Qualified technician numbers are becoming less of a concern due to falling vacancy rates.
KPI's for Supply
The key performance indicators used to track supply levels
ZEV Product Suitability
2025: Accelerating
2024: Accelerating
2023: Accelerating
Vehicle affordability
Vehicle efficiency
Vehicle charging speeds
Vans minimum range
Vehicle affordability – In 2025 7% of all new BEV cars were under £30k – a rise from 13 to 25 models [DfT, 2024], [EV Database]. There are now 12 affordable car models under £25k up from 5 models in 2024. There are only 2 van models available below £30k [DfT, 2024], [Manufacturer specs].
Vehicle efficiency – The efficiency of cars remains similar to 2024, with 82% reporting efficiency of greater than 3 miles per kWh compared to 84% in 2024.
Vans reporting efficiency of greater than 3 miles/kWh reduced slightly to 39% compared to 43% in 2024, which may be due to some larger vans reaching market.
HGVs reporting efficiency of greater than 1 mi/kWh have marginally decreased to 50% from 67% in 2024. This reflects the entry to market of several artic models with lower efficiency. [EV Database, Manufacturer specs, Ricardo analysis]
Vehicle charging speeds – For cars, 89% of EV models support at least 50 kW rapid charging, with nearly a fifth of models (19%) offering ultra-rapid charging (>150 kW).
For vans, 62% (20) models have a maximum charging capabilities between 75-100 kW, whilst only 2 models can rapid charge above 150 kW [Manufacturer specs, Ricardo analysis]
Vans minimum range – 17 (57%) of the most popular van models (covering 99% of market sales) had a range greater than 200 miles, an increase from 15 models (43%) in 2024. However, real-world range is significantly reduced when considering payload and temperature, and high range models remain unaffordable for many operators [Manufacturer specs].
ZEV Product Satisfaction
2025: Brakes on
2024: Brakes on
ZEV Sales and Origin
2025: Accelerating
2024: Accelerating
2023: Parked

Aftermarket
Services
2025: Cruising
2024: Brakes on
2023: Cruising
Number of qualified ZEV technicians
ZEV repair times and costs
Number of qualified ZEV technicians – TechSafe qualified technicians reached 65,300 in 2024 (27% of all technicians), maintaining the surplus of EV-trained technicians seen in 2024. The overall availability of technicians could be compromised with a vacancy rate of 2.9% and where regional disparities exist. [IMI]
ZEV repair times and costs –Repair times and parts costs for BEVs remain lower than ICEV counterparts in 2025. BEVs have 25% shorter repair times and 45% lower parts cost than ICEVs [Fleet Assist].
Did you know?
Key Insights
Supply
5
new ZEV car models now under £25k
ZEV Affordability
As ZEV technologies and supply chains mature, price level in entry-level electric cars and vans are falling and model capabilities are improving. For cars, the number of affordable models below £30k has increased from 13 to 25 models in 2025. The £20-30k model segment experienced the fastest growth of any price bracket with a substantial increase in cars under £25k over the past year, from 5 models in 2024 to 12 models today. The average range for sub-£30k models increased from 150 miles to 158 miles.
Vans have shown reducing upfront costs and increasing capabilities across the market. The average range for the most popular van models rose from 184 miles in 2024 to 206 miles in 2025 with most models (19) are now capable of charging speeds of at least 100 kW. There are now 12 van models under £40k (9 in 2024), 2 under £30k (zero in 2024), and one model now below £20k. Whilst the picture is improving this does not match where demand lies.
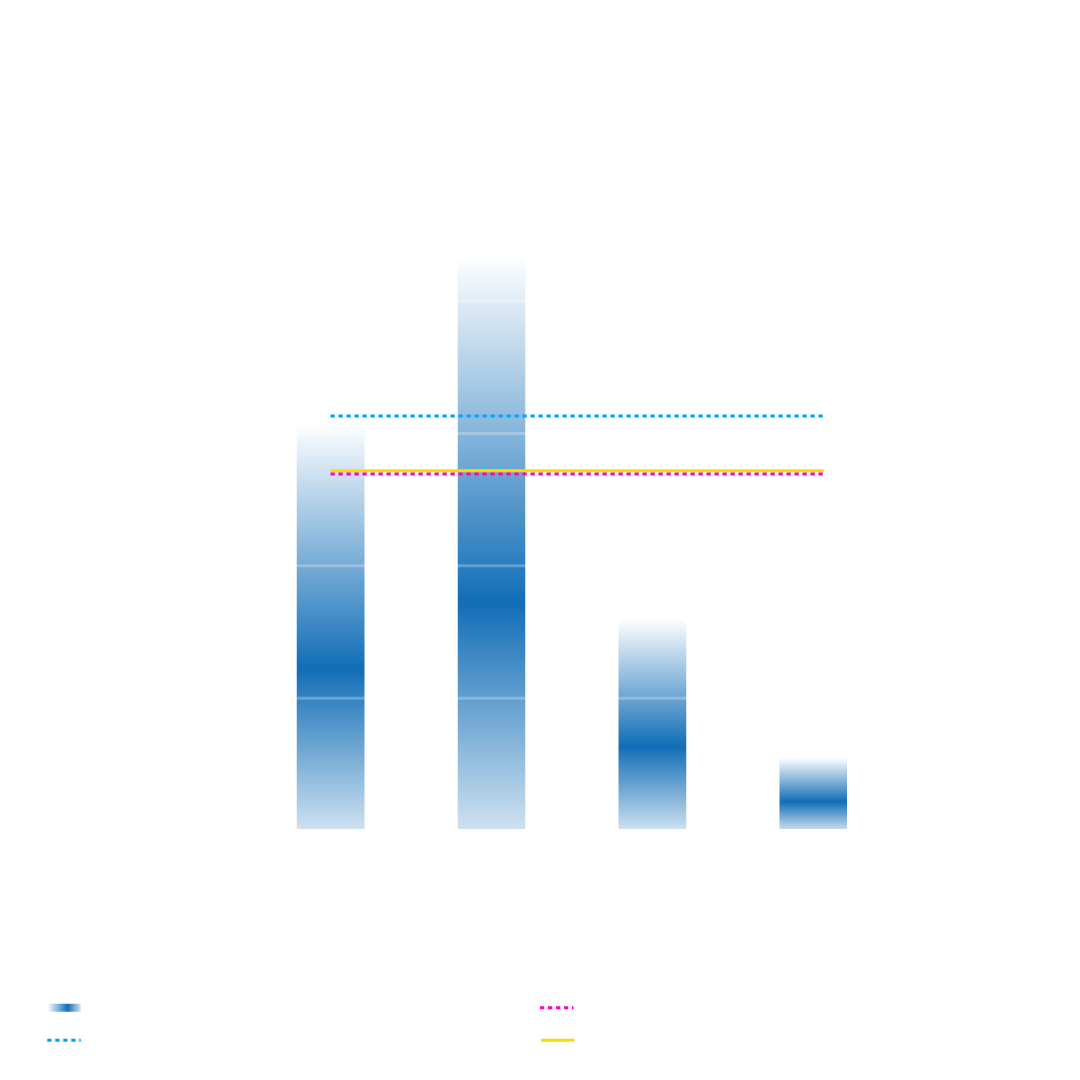
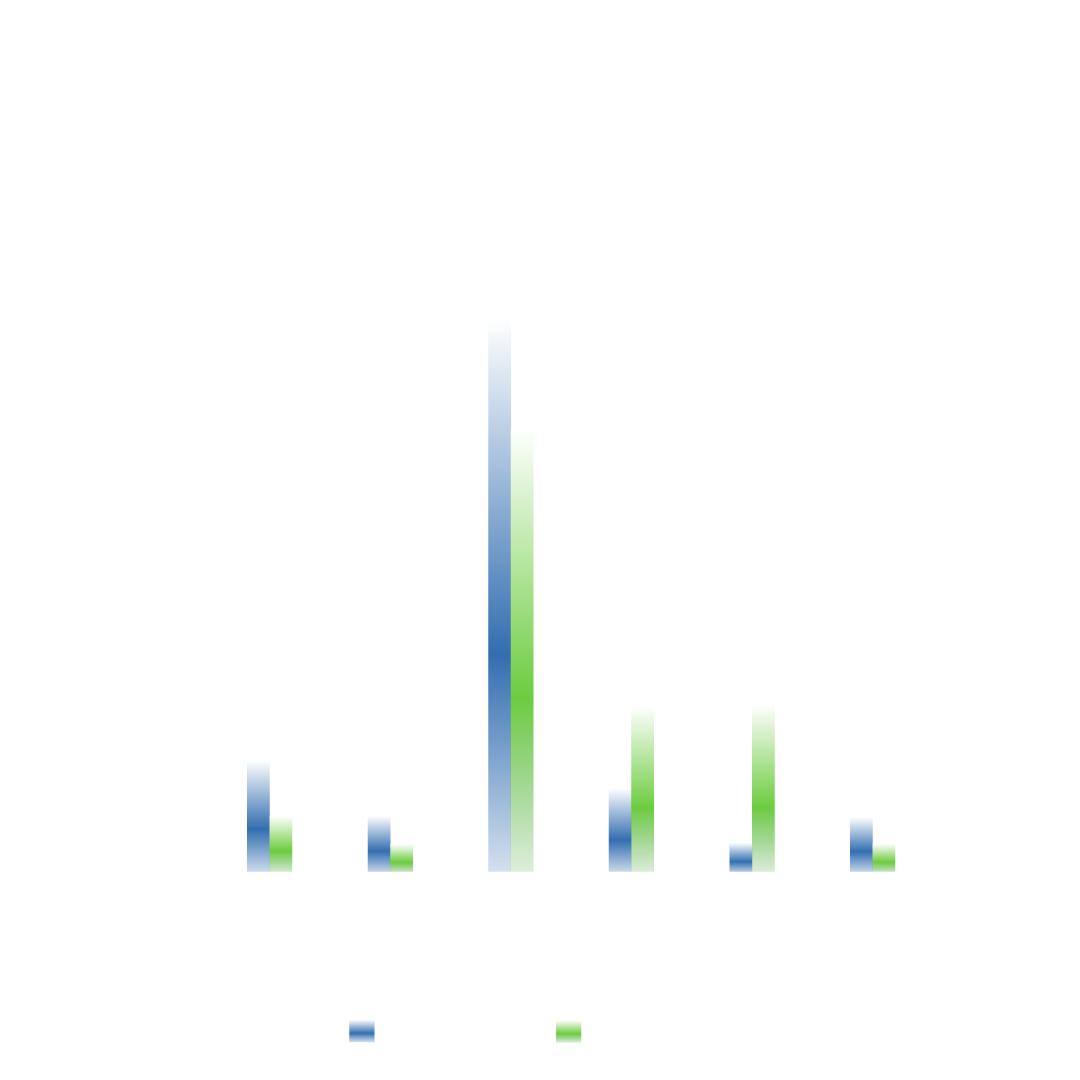
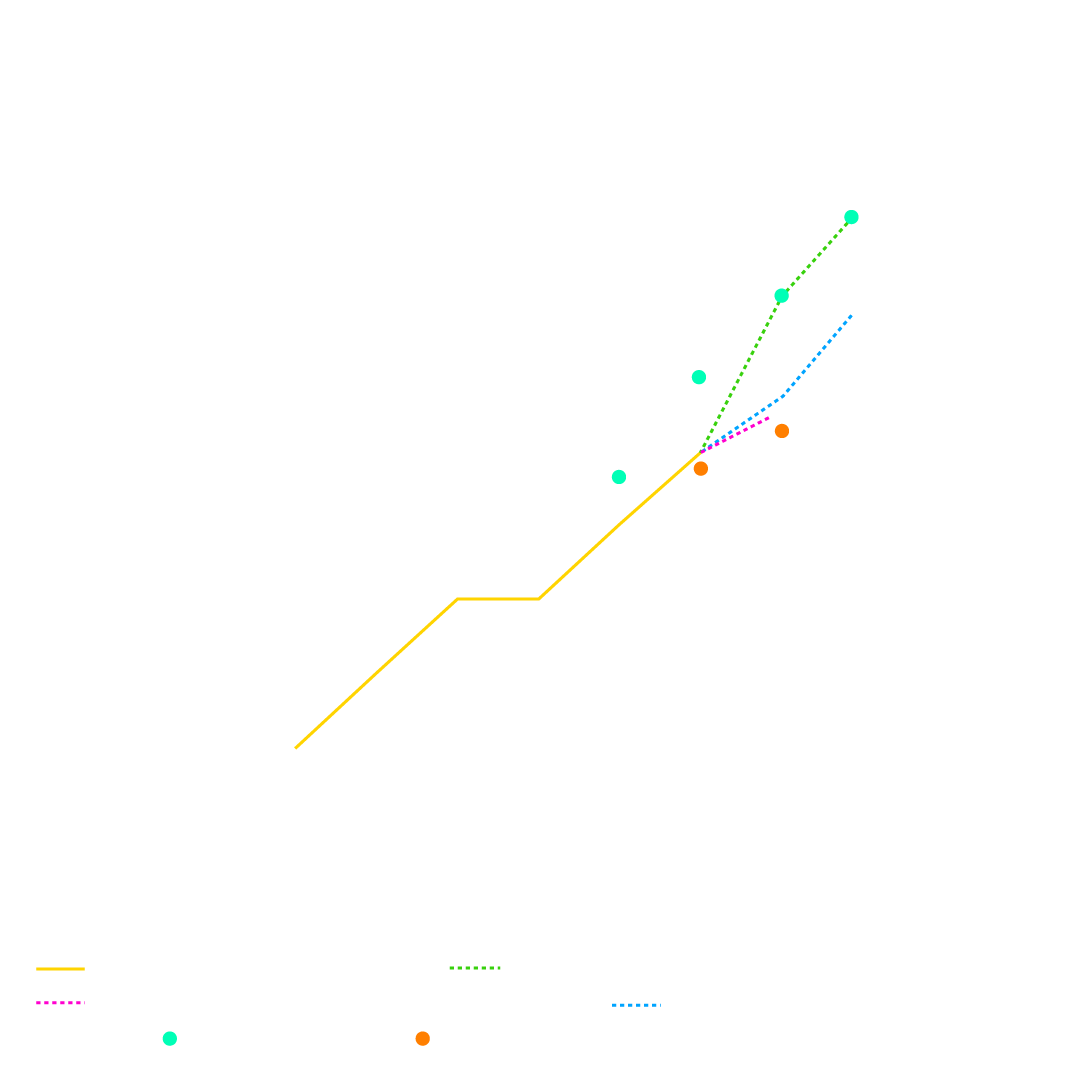
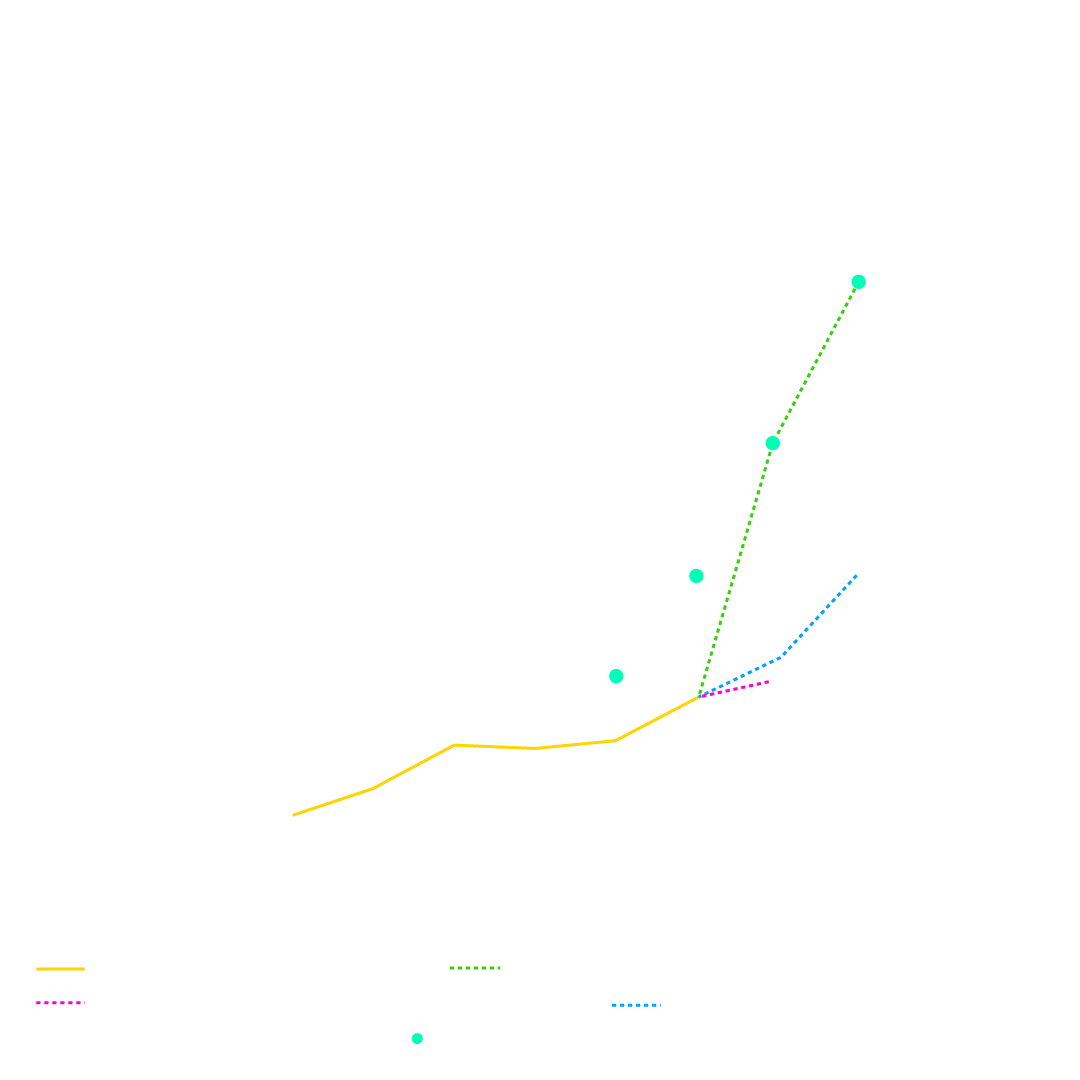
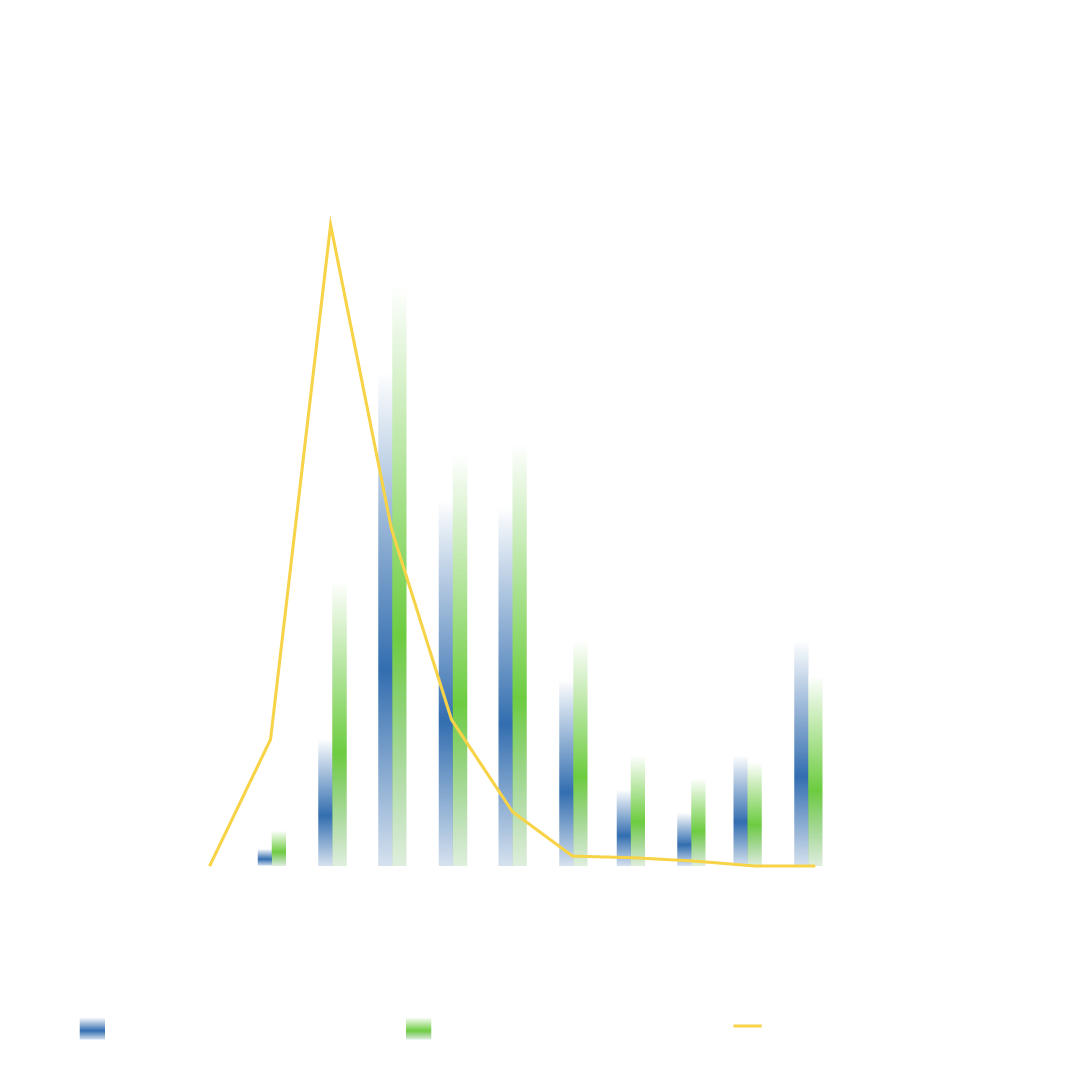
These graphs compare ZEV models available by price band for cars (left) and vans (right) in 2024 and 2025, with total ICE model registrations by price (2024)overlaid for comparison. Since 2024, affordable ZEV models have increased, with the choice of car models in the sub-£30,000 price range doubling. However, there remains a lack of ZEV model choice for cars in the most popular price brackets, notably below £30,000 where most ICE cars are sold, whilst there are few vans below £30,000 despite being popular in terms of ICE van registrations.
ZEV Sales and Origin
In 2024, ZEV sales reached 19.6% for cars and 6% for vans, falling short of the headline targets in the ZEV Mandate of 22% and 10% respectively. Despite this, manufacturers are expected to achieve compliance by exceeding CO2 targets, generating convertible credits, and utilising trading and borrowing flexibilities.
The increased borrowing flexibilities until 2030, introduced earlier in the year, and changes to technology definitions post-2030 could potentially delay zero-emission model development and shift focus to the hybrid electric vehicle market. [REF]
Car ZEV registrations are projected to reach 24.5%, exceeding the adjusted effective target. This growth is aided by a near doubling of affordable electric car models (under £30,000) to 25 models.
Van ZEV growth is anticipated despite continued challenges around their range, payload, costs, and access to chargers. Driven by grants and new models, electric van sales are projected to reach 9% of the market, but manufacturers are expected to need to use flexibilities to meet the van target of 16%. [REF]
Current and projected electric car (left) and electric van (right) share of sales relative to the ZEV mandate target between 2024-2026, as well as real-world compliance levels for car manufacturers in 2024 and 2025 once flexibilities under the ZEV mandate are accounted for.
Source: Ricardo analysis of DfT data (2024) and SMMT forecast (2024) for historic and projected sales shares. New Automotive (2024, 2025) for real-worldcompliance levels of cars.
Aftermarket Services
Over the past year, the 2024 shortage in industry-wide motor trade jobs has reduced. In March 2025, there was a 2.9% vacancy rate in the motor trade sector, which is down from 3.8% in August 2024, with the average vacancy rate across all sectors reducing from 2.7% to 2.4% over the same period. [REF] The reduction in motor trade job openings has outpaced the UK average, highlighting a recovery and stabilisation of roles, including service, maintenance, and repair.
The number of EV-trained technicians in 2025 continues to exceed the demand for service, maintenance, and repair. A previously forecasted deficit in EV-trained technicians in the early 2030s is being downgraded year-on-year due to strong training progress towards achieving a sufficient skills capacity in the UK workforce in preparation for widespread EV adoption. [REF]
In 2025, repair times and part costs for service, maintenance, and repair of BEVs remain more competitive than ICE counterparts, with 25% lower repair times and 45% lower parts cost (Fleet Assist, 2025 ). For more significant repairs and jobs, BEVs were reportedly completed in 5.5 days, around half a day quicker than ICE.
Van Suitability Range vs Price of Top Models
Most small vans fall within the £30k-40k price range, with lower GVW and battery sizes allowing 4 models (57%) to exceed 200 miles. However, larger vans with heavier GVW are more expensive due to larger battery requirements, resulting in only 2 large van models under £40k with over 200 miles range. The remaining five >200-mile models range from £49k to over £80k, making them unaffordable for most fleets.
Spotlights
Spotlight
Destination Charging
A lack of chargepoints at destinations such as hotels and leisure venues may be a significant “unseen” barrier to EV adoption – affecting tourists, business travellers and is a key factor impacting rental EV utilisation.
A key barrier to EV uptake for longer trips is not just the presence of destination chargers, but how easily drivers can access and use them.
A study by SMS plc found that 48% of UK EV drivers would avoid staying at hotels without onsite charging [REF]. Furthermore, 67% stated that the availability of EV charging influences their choice of accommodation [REF]. Lack of charging provision is a barrier for EV-driving tourists and business travellers and adds to the challenge of low EV utilisation amongst rental fleets.
Over 4,400 chargepoints (6%) are located at accommodation in the UK [REF]. Whilst there are areas of good practice [REF, REF, REF] this is only 0.45 chargepoints per hotel in the UK [Zapmap].
Data provided by Zapmap shows how many chargepoints at hotels are rapid or ultra rapid, suggesting they have not been provided with overnight guests in mind.
In addition to hotels, there are currently approximately 3,089 public chargers located at leisure destinations, these include theme parks, wildlife parks and sport facilities/gyms. These sites may have occasional or regular visitors staying several hours, making them well-suited for slow and fast chargers—which together make up over 80% of the devices across all leisure destinations.
The Southwest has the highest number of chargepoints per hotel, with a total of 888 across 1,165 hotels, which may reflect the region’s tourism-dependenteconomy with 12% of hotels in the UK. Notably, slow chargers dominate here,which aligns with the needs of overnight hotel guests. Scotland presents a different kind of gap. While it has a relatively high number of hotels (1,550), it shows a below-average chargepoint density (0.34 per hotel), though it has a notably high number of fast chargers compared to slow chargers. Northern Ireland, with just 190 hotels, manages a commendable 0.62 chargers per hotel with a relatively high provision of fast chargers. The Northeast of England has fewer hotels (265), but a charger ratio (0.49) closer to the national average.[ONS, Zapmap]
A key barrier to EV uptake for longer trips is not just the presence of destination chargers, but how easily drivers can access and use them. While the data suggests that there are around 0.45 charge points per hotel, websites likeBooking.com suggest that far fewer listings visibly offering charging (e.g. only 66 of 554 hotels in Cornwall, with similar gaps elsewhere).
This disparity points to a deeper issue: travellers need confidence that chargers will be functional, accessible, and ideally reservable. Better visibility and booking options, particularly for destinations where cars charge for only a portion of a long stay, could help manage turnover and reduce uncertainty. They should also be appropriately specified; rapid chargers are unnecessary for all-day or overnight stays, while slow chargers may not be sufficient for long distance travellers stopping a few hours at an attraction.
Many drivers may not be familiar with public charging, booking and payment systems should be easy for all users. Hotel or attraction staff need to help raise awareness of the charging on offer and how visitors access this.
Spotlight
Access to affordable cars
We have seen a big increase in the number of cars below £25,000 entering UK ranges.
What will this mean for the market?
The availability of lower-cost BEV models has been a significant gap in the market, but it is not yet clear how well the market will take them.
Innovations in electric powertrains, falling battery costs and weight savings have allowed manufacturers to increase the efficiency of BEV models across all price segments, aided by ramping up of BEV production in Europe and entry of low-cost models from Chinese manufacturers and other new entrants [REF, REF, REF]. Competition from new entrants may be helping drive prices down, but most of these affordable models are by established European brands which consumers are more familiar with.
Lower price models tend to be smaller and lighter (all are A or B segment) with smaller batteries and so achieve better efficiency. While 82% of all electric cars on the market have an efficiency greater than 3 miles/kWh, all the sub £25,000 models exceed 3 miles/kWh and four of them achieve 4 miles/kWh. With an average battery size (37 kWh) (half of the market average) these affordable vehicles have lower ranges. None exceed 200 miles range, compared to 74% of the overall market exceeding 200 miles. The average range of affordable models is around 139 miles, with a 160 miles maximum.
The availability of lower-cost BEV models has been a significant gap in the market, but it is not yet clear how well the market will take them. The uptake of affordable BEVs is likely to depend on their total cost of ownership (TCO) compared to similar ICE alternative new cars and compared to the nearly new used EV market, which may offer larger or more premium options for a similar price. They will potentially enable more drivers to take advantage of salary sacrifice schemes to get a new BEV, including younger drivers and those on lower salaries.
Smaller cars are popular in hire fleets, but as noted elsewhere, the scale of the public charging network is currently limiting the uptake of EVs within hire fleets, although they may prove well suited to car clubs and business pool cars. However, the smaller size and lower driving range of these models may dissuade some consumers and limit widespread adoption to urban drivers and second car applications. For some of those drivers without private parking the availability and convenience of public infrastructure remains a barrier, as might the lack of accessible chargers for disabled and elderly drivers. If manufacturers are to keep EV sales growing in line with the ZEV mandate, the success of these affordable models and those that follow them will be critical.
Spotlight
Used BEV Market Incentive
Evidence suggests that the UK market for used EVs is performing worse than in other European countries. ICDP/Indicata data reveals the average used EV price has fallen 46% between 2021 and 2024 compared to 19% for ICE.
Falling residual values impacts the total ownership costs of new EVs, and by extension, could be hampering uptake of new EVs
Evidence suggests that the UK market for used BEVs is performing worse than in other European countries. ICDP/Indicata data reveals the average used BEV price has fallen 46% between 2021 and 2024 compared to 19% for ICE. By comparison, the average used BEV price fell by 9% in France, 12% in Italy and 26% in Germany over the same period. Falling residual values impacts the total ownership costs of new EVs, and by extension, could be hampering uptake of new EVs and slowing the transition to zero-emission motoring.
The UK used car market has unique characteristics. Being right-hand-drive and separated by sea, imports and exports are lower than much of Europe. ICDP identified there are 3.9 used sales for each new vehicle sale, compared to 2.3 in Germany which has a similar sized new market. Many new vehicles and the majority of BEVs are first sold on lease schemes, resulting in a healthy supply of quality used vehicles less than 5 years old. In the used market, demand is lacking for the more expensive, premium vehicles. Mention has been made of the competitiveness of Chinese brands entering the new market; while the EU has introduced tariffs that increase their costs [REF] there are no plans to do so in the UK, and more low-cost new BEVs could further erode used BEV demand.
There may be lessons for the UK from other countries where used BEVs benefit from greater incentives. The rapid adoption of BEVs in Norway has been driven by exemptions from value-added tax (VAT), registration fees, and road tolls, as well as perks like free parking and bus lane access, [REF] which benefitted used as well as new buyers although they have been gradually reduced since 2023. [REF] The Netherlands offers a subsidy of up to €2,000 for the purchase of used electric vehicles priced under €45,000 as well as discounted road tax [REF]. Used BEV sales in Australia grew 73.4% year-over-year in early 2025 [REF] where a new low-interest loan scheme offers BEV buyers (new or used) up to $8,000 savings on a $40,000, 7-year loan, [REF] as well as state-level rebates in select jurisdictions. [REF]
In the USA, used BEV sales surged by 62.6% year-over-year in 2024, accounting for 1.9% of the total used-car market, with each month in Q4 showing strong increases compared to 2023. [REF] The U.S. Inflation Reduction Act introduced a $4,000 tax credit for used EV purchases in 2024, [REF] where around 30% of used BEVs are eligible. ICDP quote YouGov data suggesting 28% of US used car buyers were open to buying a BEV, compared to just 20% in the UK, despite daily driving mileage being lower in the UK. The experience of these markets suggests demand for used BEVs can be incentivised through appropriate and targeted measures.
Other BVRLA projects you may be interested in
Special thanks to:
Contributors and Members
Contributors | Members |
Autotrader | 3B Vehicle Hire Limited |
Allstar | Accident Repair Centre (Scotland) Limited |
BCA | ALD Automotive |
Cap hpi | Alley Cat Car & Van Rentals Ltd |
Fleet Assist | Alphabet (GB) Ltd |
Hubject | Arnold Clark Finance Ltd (HO) |
New Automotive | Arval UK Ltd |
Octopus Electroverse | Autohorn Fleet Services Ltd |
Ofgem | Avis Budget UK Ltd |
Paua | Close Brothers Vehicle Hire Ltd |
Zapmap | DAF Trucks Ltd |
| Dawsongroup Vans Limited |
| Enterprise Mobility |
| Europcar Group UK Ltd |
| Fraikin Ltd |
| Herd Hire Ltd |
| Hertz UK Ltd |
| Kinto UK Ltd |
| LeasePlan UK Ltd |
| Leasys UK Ltd |
| Lex Autolease Ltd |
| Miles & Miles Ltd |
| Novuna |
| N.I.I.B. Group Limited |
| Octopus Electric Vehicles Ltd |
| Pendragon Vehicle Management Ltd |
| Prohire Limited |
| Radius Vehicle Solutions Ltd |
| Reflex Vehicle Hire Limited |
| Rivus Fleet Solutions Limited |
| SG Fleet Solutions UK Ltd |
| Sixt Rent A Car Ltd (HO) |
| Thrifty Car & Van Rental |
| Tusker |
| United Rental Group Ltd |
| Zenith |
| ZIGUP Plc |